
(Update on 26 Feb)
We are delighted to announce that the following workshops will be held from 12:00-16:30 of 3rd March (Sunday). Below is the timetable and room allocation. Please note that the workshops are in-person-only events and will not be available as online content. Each workshop venue is equipped with an HDMI terminal and a projector (or large display). For presentations, please use your own PC. No one other than the presenter may use the power supply during the workshops.
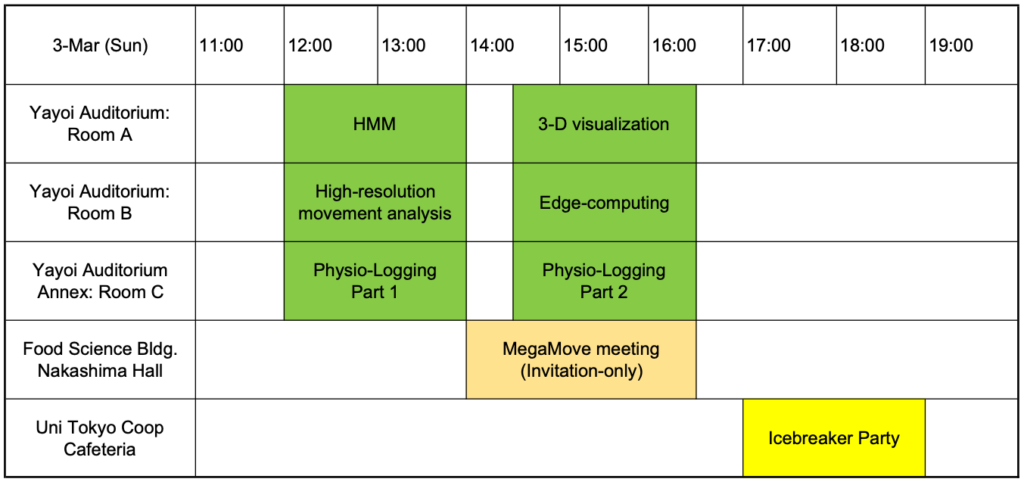
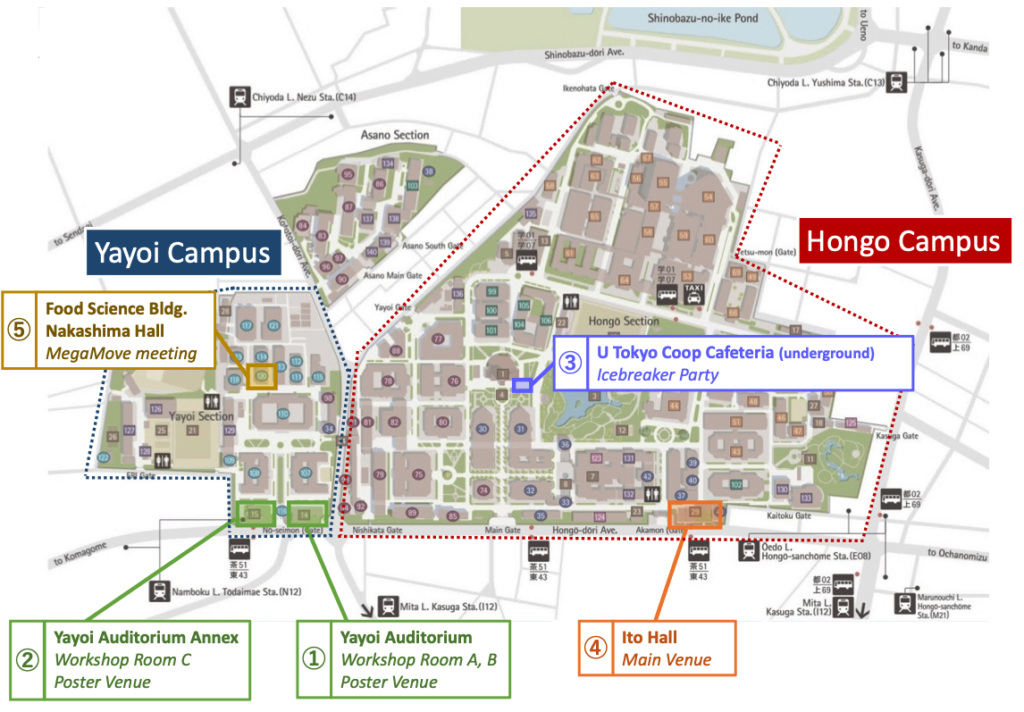
Please refer to the campus map below for the location of the venues.
Workshop Content
Physio-Logging Part 1: Heart Rate and Energy Expenditure with Physio-Logging*
Physio-Logging Part 2: The New Era of Physio-Logging and Their Grand Challenges*
(Organized by Asgeir Bjarnason and Andreas Fahlman)
The field of bio-logging has increased in the last couple of decades with an increasing number of studies investigating animal movement and behavior, either by electronic sensor-carrying devices that store the data (bio-logging), or those that transmit the data directly (bio-telemetry). Studies on the eco-physiology of free ranging animals has not seen a similar increase, mainly due to technological limitations in sensor and tag development. However, to understand the species physiological limits and plasticity, measurements of the baseline physiology and their physiological responses are needed to comprehend their ecology and evolution.
A number of marine and terrestrial animal studies have tried to assess daily energy expenditure (EE) through physio-logging with various commercial and customized solutions measuring body temperature, acceleration and heart rate.
In this workshop, we present state of the art physio-logging methods with special emphasizes on both short term and long term heart rate measurements in various species addressing methodological challenges of recording and processing such data. We also include presentations of new technologies and trends as well as development of some new physio-logging tools that will enable both physiological capacity and energy use to be estimated.
Speaker list (updated on 2nd Feb 2024)
Time Speaker Topic
PART I Heart Rate and Energy Expenditure with Physio-Logging
12:00 Andreas Fahlman: Introduction
12:05 Asgeir Bjarnason: Processing of ECG signals across the animal domain
12:35 John Fleng Steffenssen: Measuring heart rate in bluefin tuna for one year with a novel tagging method
13:00 Kentaro Sakamoto: Measuring heart rate non-invasively from sea turtles swimming freely in the ocean
13:25 Shannon Currie: Insights into Torpor: Exploring Heart Rate and Body Temperature in Small Mammals
13:50 Discussions
PART II The New Era of Physio-Logging and Their Grand Challenges
14:30 Andreas Fahlman: Introduction
14:35 Ashley Blawas: Respiratory strategies of diving short-finned pilot whales: anticipation or reaction?
14:55 Asgeir Bjarnason: Inspired Development: Physio-loggers Derived from Smartwatches and Fitness Trackers
15:15 George Sato: Estimation of diving respiratory air volume of elephant seals from descent glides
15:35 Adam Smith: Electrophysiological auditory measurements in free-swimming cetaceans
15:55 Max Czapanskiy: Cyberinfrastructure for physiologging: sharing data and code fuels discovery
16:15 Discussions
Using hidden Markov models to uncover ecological state dynamics from biologging data (Organized by Roland Langrock and Jan-Ole Koslik)
Aim & Content:
Hidden Markov models (HMMs) are flexible statistical models for time series observations driven by underlying states. Over the last decade, HMMs have become increasingly popular within the ecological community as they allow to uncover behavioural state dynamics from noisy sensor data. A typical HMM-based analysis of ecological sensor data would for example involve the investigation of internal (e.g. sex, size, age) and external (e.g. temperature, habitat) drivers of behavioural state occupancy.
This short workshop will introduce HMMs and their practical application to animal movement and acceleration data. After explaining the basic model formulation, outlining the most important extensions, and providing a quick overview of how to conduct statistical inference, several case studies in R will be shown and discussed (e.g. GPS data, overall dynamic body acceleration data). During the conference, the instructors of the workshop will be happy to discuss potential HMM-based modelling of the participants' own data!
Edge computing on bio-loggers (Organized by Hui Yu)
Studies of wildlife are often marred with problems of accessibility and observability constraining data collection. However, with the advent of machine learning and, more recently, edge computing, there is increasing potential for a step-change in elucidating the ecology of the globe’s wildlife.
Most ecological research follows a conventional data collection and processing framework, where raw data is first collected (e.g. using bio-loggers, GPS and radio tags, or camera traps) and then processed post hoc (e.g. using a personal computer or cloud-server). Edge computing is the deployment of computing and storage resources close to the data source. This new paradigm reduces data transmission-latency and bandwidth use. Wildlife ecological research benefits from edge computing in multiple ways. Edge computing allows for research with improved resolution and duration. Low data latency, such as anomaly detection, enables quicker responses from researchers and managers to conduct in situ evaluation (e.g. in social network analyses, disease ecology, or anti-poaching). Automatized triggering logic through edge computing facilitates better battery and storage use, which enables high-throughput automatic remote wildlife monitoring.
This workshop aims to (1). introduce currently applications of edge computing in bio-logging studies; (2). step-by-step demonstration of edge computing on accelerometer data for animal behaviour classification, using supervised machine learning approaches.
Contents
1. Introduction of the concept of edge computing and presentation of representative applications in wildlife behaviour and ecology research.
2. The tracking system for edge computing on bio-loggers, including hardware, software, data transmission modules.
3. Explanation of collection of raw accelerometer data with behaviour labels; coding tutorial using rabc R package for supervised machine learning model training and validation (including raw data visualization, feature calculation, behaviour data clustering, model training and validation); the output from this package can be used as the edge computing algorithm.
4. Introduction of using an alternative way for edge computing on accelerometer data using deep learning framework (python code tutorial).
5. Open discussion among audiences: would you like to use edge computing in your research and how can it be helpful.
High Resolution Movement Analysis (Organized by Stacy DeRuiter and Mark Johnson)
(Workshop title and contents updated on 18 Jan 2024)
Many biologging tags record data from some sensors (e.g., accelerometers) at higher sampling rates than others (e.g., magnetometers and pressure sensors). The resulting multi-rate datasets are a rich source of information about animal behaviour but can be challenging to analyse. In this workshop we will first discuss the optimum choice of sampling rate for each sensor type and why this inevitably leads to multi-rate data. We will then introduce methods for exploring the different biomechanical signals in these data and for combining data safely across multiple sensors. The workshop will include follow-along examples using R tools and open data from animaltags.org.
Objectives
- To develop an understanding of the different types of information about animal behaviour that are embedded in accelerometer and magnetometer data collected by biologgers.
- To appreciate how the various physical actions measured by these sensors (e.g., posture changes, locomotion, strikes at prey) have different frequency ranges and time scales.
- To gain an intuitive understanding of how signal processing operations such as filtering and decimation can be used to separate out the information in accelerometer and magnetometer data, facilitating inference of behavioural states, quantification of activity levels and event detection.
- To answer questions like: 'Why does my tag record accelerometry at 32 Hz and magnetometer at 1 Hz? How do I best use sensor data that is sampled at different rates?'
Immersive 3D Visualization for Biologging Data (Organized by Jessica Kendall-Bar)
Many of us have squinted at timeseries data to reconstruct mental images of our study species in an obscure, far away place. In this workshop, we will explore ways to let your biologging data come to life using non-traditional visualization techniques- think less MATLAB and more.. animation software and game engines. With new advances in computation and rendering software, we can feed large quantities of data into photorealistic scenes for data-driven storytelling. By visualizing our data, we can generate insights more quickly, share our science with others, and gather momentum to protect critical habitats around the world. We will share some guiding principles for data visualization, share code and resources for "diving deeper" with 3D software, and do some hands-on demonstrations using applications like Autodesk Maya and Unreal Engine. By the end of the workshop, you will be able to identify different techniques and software options for visualizing 3D biologging data and have the tools to move forward in your journey as a data-driven storyteller.